Monday, February 26, 2018

QGM Seasons with new PER calculation

Version 0.06 Playthrough


So I am going to play through several seasons with this new PER calculation.

My Team:

I picked the Muggle Artefact Investigators, under the silly idea that Arthur Weasley decided to coach the team. He loves trying these new Mugglicious ideas like analysis and Trust the Process.

Season 1:

The MVP was Luca Mitchell, with a OVR of 50. His PER was 30.5, which at least marches what we expect of an MVP.

He hit a good percentage of 2s and FTs, but never took a 3. His steals and blocks were decent, but he seemed to be excellent in ORB and DRB.

So my first conclusion, is I'm not sure about him having so high a PER, but it seems the game is valuing all player types once again. Which I didn't expect to see coming out of my model.

Luca was also defensive player of the year. I don't know where the Defensive award comes from, stat wise.

It might make more sense to do an real-life MVP adjustment in the future, as Luca's team didn't even make the playoffs.

The Muggle Artefact investigators struggled with injuries and poor performance all season, ending up 25 - 57.

Arthur lowered the ticket prices to get people into the stands.  The Magical Creatures down the hall had the biggest budget of all teams, with 166 million spent on payrolls.

2017 Draft:

Arthur picked Zach Read 7th, a 22 YO Forward 60/64 with 3 point tag, and Harriet Smith, a 22 y.o. small forward in the draft.

2017 Free Agency & Re signings:

Arthur wasn't attached to any of his players except the rookie Zach Read.

Many players up for free agency refused to resign with the awful Artefact team.

Isabella English wanted the max, and Dominic Briggs wanted 18 million. 

The salary demands seemed high, but reasonable enough based on overall ratings. Not ridiculous like before.

Arthur paid the young Briggs, but dropped English and two other atrociously bad players with overall ratings in the 20s.

Before signing anyone, Arthur had 38.5 million in cap space, but it seemed prudent to stay a bit more under the cap, until the team's financials were steadied.

Aya Higgins was all the team had for a Point Guard, at 45 ovr. Briggs, Booth and Read were a solid 2,3,4, with Booth and Read having seeker skills.

Wiktor Howard was a good center. Their bench had a little strength at Small Forward, but no back up guards or additional seekers.

Arthur went looking for a Point Guard, especially one with snitch skills.

Many players had a bad attitude towards Arthur when he talked with them, but Cameron Clark, 27 was willing to talk about a deal for a measley 3.88 Mill.


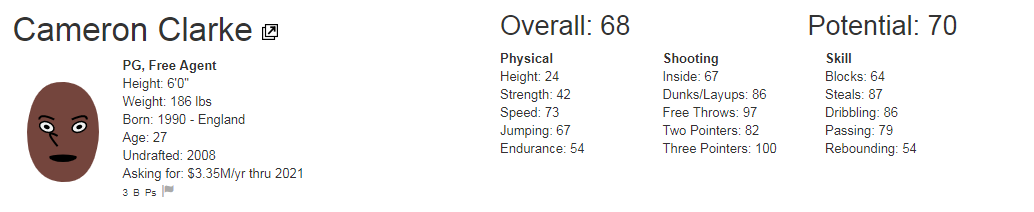
Arthur was able to sign Clarke for only a small premium over what other teams were offering, despite the fact that Clarke was insulted by Arthur's presence. 

[The fact that Clarke went for so little seems to be a goof in player FA values, but let's see how he plays.]

Clarke's PER was only 12.5 last year, so he may be more sizzle than sauce, but Arthur is willing to look for diamonds in the rough.

Next, he looked for a few young bench guys or gals.

He signs Isaac Cooper, for the flash, and Isla Hamilton, for her youth. 2.85 mill for Isla and 0.85 for Isaac.

He's now gone a bit overboard, stocking the PG position a ton. So he goes looking for another center.

He signs center Corey Bailey, who had a good PER, and a bench guy's OVR last year.

Training Camp

Briggs and Booth lose a little over their last season, Cooper and Hamilton also decline. And some of the back benchers are now so terrible, they won't play at all.

But Zach Read, #7 draft pick, improved, and some bench players like Higgins, Jones and Smith, improved.

Cooper takes Brigg's spot in the starting lineup, giving them a lineup of Clarke, Cooper, Read and Booth, fairly small, with center Wiktor Howard backing up the line.

Briggs is 6th man, followed by Jones, Higgins, Hamilton, Bailey and Smith.

Stevenson and Pierce are set to inactive status.


2008 Season


Arthur is hopeful that his Artefact Investigators will get to 40 wins this year. Last year was bad, but he's planning on either going for it, or blowing the team up and rebuilding if it doesn't work out.

After 1 week of play, the team was at 3 - 3, which was on plan, but after 2 weeks, they went up to 8 - 5, exciting Arthur and the team.

They were on pace for the 15th seed. With 41 teams and only 16 spots, it took a good team to make the playoffs.

Playing Durmstrang in the first round would be a tough matchup, but Arthur knew their place, and the other of the teams at the top was going to shift. They had a chance to make the playoffs, so he kept with the plan of keeping this group together.

Unfortunately, they dropped to 14 - 17, after a few more weeks. And then free-falled to 14 - 24.

At 17 - 28, Arthur pulled the plug, looking for some trades to get off salary and get picks.

He wanted to trade his older players first, and only trade young guys if he got a killer deal. Most of the teams that needed to win now, didn't have any cap room to add though.

He was able to trade Leo Booth for 24 YO Humphries, a seeker paid only a bit more who seemed to be better at 8 years younger. He couldn't find any draft pick deals, however.

He decided to play out the season, and work on gradually getting the team younger.

They ended up going 32 - 50, only 7 games better than last year, and well short of his goals for the team.

It was time to dump salary and go for a #1 pick next year.

Once again, a center won MVP. A center with 0 snitch catches all season.

Pre-2009

Arthur upped spending on facilities and coaches, scouting and health, because they made so much money from their share of the luxury tax paid by other teams.


The Draft Lottery was an amazing victory, as despite having only 8 balls in the lotto, the Muggle Artefact Investigators ended up with the #1 pick.

Benjamin Heath, another Point Guard, was the best option available. He was already 22, but the other players were not nearly as good, since he already had a 68 ovr. WiArthur picked a center in the 2nd round.

Wiktor Howard refused to resign, and Arthur was fine with that.

Stevenson, who didn't play last year, wanted 26 million, gone. He kept Aya Higgins, but dropped the other restricted free agents, for age or bad play.

Arthur didn't get involved in the Free Agent market at all. Leaving his roster at Heath and Clarke, starting PGs, dropping Cooper to the bench. Briggs, Read and Humphries rounding out the starters.

In a lot of good news, Heath got better during pre-season, and Briggs made a HUGE improvement to 68 OVR. 

However, there were no good centers left on their roster. Arthur wasn't sure whether to omit playing a center at all, or to put Corey Bailey at starting center. He went with the more radical idea.

Except for Briggs, everyone on the starting lineup had seeker skills. Higgins also made another big jump in pre-season, and was a good player off the bench. 

The lack of rebounding or defense was a huge hole.

The team didn't tank, getting 39 wins, but it also didn't make any satisfying progress, missing the playoffs.


Summary

The game itself seems to work fine. I could get into roster changes, position changes, or other heavy alterations, but I realize from playing it, that it still feels like the NBA cycle of boom or tank. 

I've decided to work next on changing the League structure to feel different, more like a feeder system than an NBA system.

My next post will be on these changes.

Quidditch GM: Winning Probabilities

Hyper-Simple Model


Let's start with a very simple model: The home team has possession, and the score is tied.

Consider W_H(poss, d) to be the probability the Home team will win if the poss team has the ball, and if they have a score differential of +d.

We'll assume later based on mini-maxing, that the best decision was made at each point, but this is a crude decision tree, where the team with possession can decide to shoot a 2 or a 3 at each possession, there are no turnovers, and possession goes back and forth every time.

Let's further assume that Home and Away have the same odds for taking a 2, or a 3. G, for goal, is the chance of making a 2, S, for snitch,  is the chance of making a 3. For now, exclude the idea of free throws.

Generally (if we assume ties when the snitch is caught are 0.5 wins in value, and toggle(poss) is the function from home to away and away to home):

W_H(poss, d) = [3] (S (sgn(d + 150) + 1) / 2 + (1 - S) W_H(toggle(poss), d)
                           [2] (G W_H(toggle(poss), d + 10) + (1-G) W_H(toggle(poss), d)


The (sgn(d+150) + 1) / 2 is just a part that returns 1 whenever d + 150 > 0, 1/2 when d + 150 = 0, and 0 when d + 150 < 0, corresponding to winning, tieing, or losing).

The sign function is awkward for doing math with, but we can approximate that expression  with (tanh(k (d+150)) + 1) / 2

Choosing K:

K = 1 is probably too sharp. It goes from 2.06E-9 at -160, to 0.5 at -150 to 1 at -140.
K = 0.1 might be reasonable. 0.12 to 0.5 to 0.88

I choose K = 0.05 because it goes 0.11 at -170, 0.27 at -160, 0.5 at -150, 0.73 at -140, 0.88 at -130, bnut still converges nicely.

Call A_H this approximate version:

A_H(poss, d) = [3] (S atanh(0.05 (d + 150)) +1) / 2 + (1 - S) W_H(toggle(poss), d)
                          [2] (G W_H(toggle(poss), d + 10) + (1 - G) W_H(toggle(poss), d)

For sub-problem 1: Let's assume Home always shoots 3s, and away always shoots 2. Then we don't even need to mess with this formula, because of a simple fact: Since Home always shoots 3s, they will never get their scoring differential closer. So once Away takes it to a 150 point lead, they can only tie, and once Away takes more than a 150 point lead they win.

So what is the probability that Away makes N goals before Home makes a snitch?

This is getting to a simpler combinatorics problem:

Start with N = 1, Away has to make 1 goal before Home gets the snitch, but Home gets to go first

Paway(1) = (1-S) G

Then consider arbitrary N

Paway(N) = (1-S) G Paway(N-1) + (1-S) (1-G) Paway(N)

Collecting terms:

(1 - (1-S) (1-G)) Paway(N) = (1-S) G Paway(N-1)

This is a simple geometric recurrence.

(1-(1-S-G+SG)) Paway(N) = (1-S) G Paway(N - 1)
(S+G-SG) Paway(N) = (1-S) G Paway(N-1)

Paway(N) = (1-S) G / (S+G -SG) Paway(N-1)

So Paway(1) = (1-S) G
Paway(2) = (1-S)^2 G^2 / (S+G-SG)

Paway(15) = (1-S)^15 G^15 / (S+G-SG)^14

Probability of the away team winning or tying is thus this value.

Let's assume S = 0.01

P15 = 0.99^15 G^15 / (0.01 + G - 0.01 G) ^ 14

Let's look for G where
P15 = 0.5

There are 20 pages of players with 3P % > 1% in the current season of QGM. So that is a very low mark. Some have as much as 6.8% 3PM.

0.865 G^15 / (0.99 G + 0.01)^14 = 0.5
G^15=0.578 (0.99 G + 0.01)^14

Real solution:

G = 0.6278

So that's lower than I thought.

What about for S = 0.03 (top 20 in the QGM are at this level or higher)

0.633 G ^ 15 / (0.03 + G - 0.03 G) ^ 14 = 0.5
0.633 G ^ 15 / (0.97 G + 0.03) ^ 14 = 0.5

G = 0.85033

General case

Prob Curve: Roughly speaking, 1% better in 3P% requires 10% better in FG% to match up.

50% line -

if 2P% = 0.55 + 0.1 3P% then V(2P%) ~ V(3P%)

If we change the 3P line for PER from 28 to 9 (9 + 1 = 10, 10x value of 2s) will it make more sense?

The negatives are happening through other parts of the formula.

Let's make our own Monte Carlo model and conclude the value of attributes.

Variables:

Pr_2 : propensity to shoot 2
2%
Pr_3 : propensity to shoot 3
3%
FR : rate of free throw chances
FT%
B% : Block %
S% : Steal %
DRB%
ORB%

For each side play hundreds of games, and see how many wins with different combos of stats.

Let's get a range of values for each of these variables to test within, and then I will write up the simulator in F# since I'm familiar with that, and it's a fun little test project:

From the player stats for QGM:

3 PT FGA / all FGA = Pr3 ranges from 0% to just over 40%

Let's model from 0.0 to 0.5 for Pr3 (Pr2 = 1 - Pr3)

FTA per 2 PT FGA : FR ranges from 0.08 to 0.53

Let's model from 0 to 0.6 for FR

FT% ranges from 15% to 50.8%

Let's model from 0.10 to 0.60

2 fg% ranges from 0 to 0.2
Let's model from 0 to 0.3

3 fg % ranges from 0 to 0.068
Let's model from 0 to 0.08

B%

We have block stats, but not enough data for a perfect block% stat

Let's look at FGA / minute on average. 0.284

Consider B% to be Blk / 0.284 Min
Consider S% to be Steals / 0.284 Min

How do we estimate a player's ORB% and DRB% when these have to be balanced so that P1 ORB + P2 DRB = 1 and P1 DRB + P2 ORB = 1 for each matchup of players?

Scale ORB / Min and Oppo's DRB / Min so that these are one, and likewise the opposite.

Our EST B% goes from 0 to 0.23. Let's take it from 0 to  0.25
Our EST S% goes from 0 to 0.26. Let's take it from 0 to 0.30

ORB/Min goes from 0 to 0.21. Let's take it from 0 to 0.22
DRB/Min goes from 0 to 0.59. Let's take it from 0 to 0.65

0.284 FGA / minute * 48 minutes * 20 quarters max = 272 possessions each until the model considers it a time runs out scenario, and picks the player with higher score as winner.

Round to 280.


Model


The Monte Carlo Model creates N distinct samples within these bands, and pairs them all off, for X round robins, to generate X*N observations of for each sample. The number of wins is totaled for each and the samples and their wins are returned.

I was thinking 1000 samples, and 1 round robin to start.


Run 1 settings:

    let qparams =
        {
            Prop3Pct = Band(0.0, 0.4);
            ThreePTPct = Band(0.0, 0.08);
            TwoPTPct = Band(0.0, 0.2);
            FTPct = Band(0.15, 0.6);
            FTPer2FGA = Band(0.0, 0.6);
            BPct = Band(0.0, 0.25);
            SPct = Band(0.0, 0.30);
            ORBRate = Band(0.0, 0.22);
            DRBRate = Band(0.0, 0.65);
        }

    MonteOutput.runMonte qparams 1000 1


Still running after 6 minutes. I don't know if that's a bug in my model or just that running a 1000 * 1000 sims its taking that long.

I bailed out after 9 minutes, and decided to try 10 samples as a test to see if the model code was working at all.

    MonteOutput.runMonte qparams 10 1

When 10 samples took over a minute, I bailed out. I ran 2 samples, and then broke into the debug menu.

Possessions left is showing at 782041226, which is way bigger than 560. Somehow my possession tracking was screwing up.

I was setting netPoss to negative, but then subtracting it, so I outsmarted myself and possessions were going up.

Now, running with 2 samples finished within a second. Running for 100 samples finished in a few seconds.

1000 samples took about a minute and a half. So then I opened the results in excel.

I ran Excel regression on the results.

My model must still be broken because 3P% shows an extremely negative coefficient of -1913, while 2P% shows positive. My model was symmetric, and was accidentally crediting the opponent with catching the snitch.

After a fix to the recursive call in my model, I tried it again. Unfortunately this change broke tail recursion, so I wasn't sure if it would overload the stack, or take way longer.

It didn't seem to take any longer though, so once again I looked to the results. This time, the model made more sense.

  Coefficients Standard Error t Stat P-value
Intercept -262.61 14.04 -18.70 4.49E-67
3PA/FGA 846.70 21.00 40.32 4.41E-211
3P% 4807.28 105.96 45.37 5.23E-244
2P% 744.02 41.03 18.13 1.11E-63
FT% 92.96 18.06 5.15 3.20E-07
FTA/2PA 113.19 13.75 8.23 5.71E-16
B% 388.90 33.09 11.75 6.10E-30
S% 455.97 27.69 16.47 4.97E-54
ORBR 570.00 37.52 15.19 5.29E-47
DRBR 248.31 12.65 19.63 1.04E-72


New PER Model

Calculated Params:

2P% = (FG - 3P) / (FGA - 3PA)
FTA / 2PA = FTA / (FGA - 3PA)

B% = B / (0.284 * Minutes)
S% = S / (0.284 * Minutes)

ORBR = ORB / Minutes
DRBR = DRB / Minutes

3PA / FGA : self explanatory


uPER : -260 + 850 3PA / FGA + 4800 3P% + 750 2P% + 90 FT% + 110 FTA/2PA + 390 B% + 450 S% + 570 ORBR + 250 DRBR

PER = uPER / (avg uPER) * 15

This should result in an average of 15, the EWAs and baselines by position may need change later, but for now, leaving the replacement PER at around 10 makes sense.

Being a relative novice to javascript, I've made my changes, but we'll see if they crash or not.

Here we go:

>npm run build
and
>npm start


Running a month, I noticed all PER was being set to 0.

After debugging, It looks like there's no Three Point attempts stat being carried over.


We can run another model, and do 3 per FGA, 2 per FGA and FT per FGA, instead of using the per 3pa or per 2pa stuff.

A lot of the P values seem even stronger in this model:

Intercept -51.94 10.54 -4.93 9.7E-07
3P/FGA 21847.30 327.85 66.64 0
2P/FGA 983.33 49.26 19.96 8.75E-75
FT/FGA 473.10 36.41 13.00 9.04E-36
B% 364.34 32.83 11.10 4.72E-27
S% 457.75 26.64 17.18 4E-58
ORBR 529.70 36.80 14.40 8.26E-43
DRBR 257.49 12.53 20.56 1.65E-78

So, I will do:

uPER = -50 + 22000 3P/FGA + 1000 2P/FGA + 480 FT/FGA + 360 B% + 460 S% + 530 ORBR + 260 DRBR

Building and trying once again:

It worked! Or at least the PERs are not 0.

Let's test with Katie Jones, a PER leaderboard entry who is a Big (Wo)Man, and Leo Howe, the current PER 2nd place, EWA first place leader

Jones: 52.4 min, 3.6 FG, 28.8 FGA, 0.1 3P, 2.0 FT, 6.6 ORB, 19.9 DRB, 2.8 S, 2.7 B

Howe: 70.6 min, 2.8 FG, 30.4 FGA, 0.3 3P, 2.9 FT, 0.8  B, 4.3 S, 5.6 ORB, 14.5 DRB

Jones uPER: 498.6116
Howe uPER: 503.5859

Jones: 33.7
Howe: 34.1

So the scaling factor is around 14.76 uPER per regular PER.

It looks right!

EWA is also looking right. It is calculated based on PER and minutes played.

Offensive Wins and Defensive Wins are still screwed up, but I don't think those affect player valuation the same, so I can worry about that later.

Time to start a new league with the new valuations, but that's for another post.

Friday, February 23, 2018

QGM: Playing through some Seasons with the busted PER / Player EVAL

I don't have a simple answer for Quidditch PER rating yet, so I'm going to play a few seasons.

To make it fun, I'm going to exploit the AIs as best I can. So far, in Quidditch GM, bigs are basically worthless. I want to add in Beaters and bludgers to fill that gap, but for now I'm going to trade all my bigs away before their crappy adv. stats make them worthless.


Trading away Ashton Wilson, Sophie Adam, Kate Mason, Chloe Weaver
Let's see what I can get for them:

Wow, Look at the Offer for Weaver (41 OVR):


I'll take that.

Next, I got
Sophia Saunders 3BPs PG 33 52 52

Not great, but better than what I traded.

For Hannah Bruce:


Not bad.

For Kate Mason:

There's a killer deal on the table with a 69 rater, but my cap space is too full for it.

Instead, I got a second round draft pick, and a 58 OVR 3 pointer.

For Sophie Adam:

Not a whole lot, so I'll keep 1 big I guess. I look with my other big, and I've either got too much salary, or the low hanging fruit is already picked over. So enough of that. Time to look at my new Ravenclaw roster:


It's not a great team, but way better than before for catching snitches.

Let's see how I do: I'll sim 40 games, and then I want to do a Live watch of one, and then make a few more trades and sim out of the season.

My team started the season like 1 - 7, and now have climbed up to the bad territory of 17 - 21.

Let's pretend that the PER displayed makes sense, then I have a negative PER player on my starters, and a 80 per player on my bench. Let's sell the bad PER player.


I'll trade him for


I'm setting 0 minutes for my 3 players with PER of -10. What will happen?

Live Game Time:

48 minutes a quarter make these long

46:03 - CHU - Evie Hawkins grabbed the defensive rebound
46:03 - RAV - James Lee missed a three pointer
46:18 - RAV - Priya Thompson grabbed the defensive rebound
46:18 - CHU - Evie Hawkins missed a dunk/layup
46:32 - CHU - Mohammed Thomas grabbed the defensive rebound
46:32 - RAV - James Lee missed a three pointer
46:47 - RAV - James Lee grabbed the defensive rebound
46:47 - CHU - Bethany Nelson missed a mid-range shot
47:01 - CHU - Emil Hills grabbed the defensive rebound
47:01 - RAV - Priya Thompson missed a three pointer
47:16 - CHU - Mohammed Thomas made a low post shot (0-10)
47:30 - CHU - Evie Hawkins grabbed the defensive rebound
47:30 - RAV - Priya Thompson missed a dunk/layup

ZZZs

0:00 - CHU - Summer Jones made a three pointer shot (assist: Emil Hills) (40-185)

First Quarter Over, Game Over.

So now, I want to hand calculate and add up all the unadjusted PER at the end of the season, and see if I get a negative total.
Simming the rest of the season.

Wait, I stopped the sim. All of a sudden, I went on a tear, up to 38 - 33. By Zeroing out these negative PER performers.
Let's see how my weekly standings go from there?

But wait, let me give my roster + and - based on time. I have another player that needs to stop playing according to PER. He has -60 PER


Here we go, was it my -60 PER player responsible for success:

3-2 Week
0-5 Week

HMM.

Let's try the playoffs on the opposite assumption: that our negative PER players are the best.
Woops, I missed the playoffs with that last slide.

Is my league average unadjusted per still negative? With the 3P term below replaced with 28 * 3P


It comes to my mind now, that since 3 pointers are so hard to make now, and since they are worth so much, Winning is WAY more random at this point. 
Your opponent can always score a three.

3 Pointers Made / Game vs. Wins


The system can't record more than 1 decimal point for 3P / Game, so there are bands, but the correlation is very clear. However, if you look at 3PA / game: 3 Attempts are slightly positively correlated with winning.


Excel doesn't let me regress more than 16 variables with Wins. And, it's probably stupid to regress that much with only 41 data points.

What about 20 seasons?
Turn on God Mode, and run some seasons. I know how to make Excel do regressions, even if it's own tool doesn't for more than 16 vars.


With the correct end of game rules and the lower fatigue, 20 seasons didn't take that long. Ever since I set the population for the school teams lower, they have had a lot less success, my Ravenclaw team only made 4 playoffs in 20 years.
No 1 team won more than 2 championships. Durmstrang was the only Scholastic team to win, and they had 2.
Stats time:
While compiling stats from 20 seasons, I discovered a bug in my Teams. Somehow the team code BAL is showing up in Team Stats 11 times! They all show up as Ballycastle.
I've got 4 teams with the same 3 letter code (BAL), and they all show up as Ballycastle when you click on them in the UI. Oops.
Looking at my JSON file, let's see:
Ooops!, all the new teams I added from the Irish and English Quidditch league, I forgot to change their initials.
I wonder if Basketball GM looks up teams by initials for stat calculations?
So, let's play a season with teams that have correct 3 letter codes and see?
PER definitely looks a bit more reasonable, still a lot of high values all over the place, but no crazy negatives, at least on my team.
The player with the best PER has Three Pointers: 91.
Durmstrang won 26 games, but has a player with 351 EWA. Something's still way off, but it's closer.
According to the js file, someone with 351 EWA would be following this equation:

EWA = players[i].stats.min * (PER[i] - prl) / 67 / 30 * 0.8

The 351 EWA player has: PER 72.2
14432 minutes : 185 m / game
Hallie Marsh is a PG. PRL for PGs is 11

185 * (75 - 11) / 67 / 30 * 0.6 = 
If we plug in her full minutes, I get 367 EWA.
Let's get the actual average PER by position, for curiosity. I can't get all of the player PERs at once in BBGM as it currently works.
So I'll export the json. I can't easily get each PER by position without diving into working with JSON in more depth, but I can get the overall distribution of PERs, by sorting all lines in Notepad++ and copying the lines with per.
Average PER: 10.93
(per is supposed to be average 15.)

Average of Positive PER: 25
# of Positive PER Cases: 407

Average of Negative PER: -13
# of Negative PER Cases: 236

Bar Chart of Quidditch PER


It looks vaguely normal-ish.
NBA PER Bar Chart


The Two shapes are broadly similar, just translated and stretched differently.
QGM PER has a mean of 10.93, median of 8.35 and st. dev of 25!
NBA PER has a mean of 14.43, median of 13.9 and st. dev of 4.75

QGM's median is lower relative to mean than NBAs.
I don't know much about advanced statistical numbers like moments and skewness and kurtosis, but let's look at them.
They both have positive skew, but QGM is at 0.41, while NBA is at 0.58.
This means their right tail is longer, but it's less so for QGM.

I'd like to go back to first principles and figure out what stats relate to winning for QGM next post.

Thursday, February 22, 2018

Transforming from Basketball Sim to Quidditch Sim

This is a new series, on my efforts to make a Quidditch league simulator from the code of Basketball GM.

Basketball GM can be played at: https://basketball-gm.com/
The Basketball GM codebase is on Github at: https://github.com/dumbmatter/basketball-gm
My Quidditch fork of BBGM is on Github at: https://github.com/apeterson-BFI/basketball-gm


Past Efforts


I had previously created a Teams JSON for import into the very customizable basketball simulator Basketball GM. The Teams JSON just changed the teams from Fake NBA team names, to Quidditch teams, both mentioned in Harry Potter, or made up from reasonable team concepts.

My initial teams covered the houses of Gryffindor (plus a team for Professors), the other Schools of Magic, the professional and national teams mentioned in the series, plus teams for species and teams for divisions of the Ministry of Magic.

Recently, after I started pursuing the full Quidditch GM project, I was made aware of the full league known as the British and Irish Quidditch League.

I have added those teams which I didn't already have.

The JSON project is compatible with basketball gm, just import my json file as a custom roster: permalink to this version.

The teams json is an important part of the Quidditch GM as a whole, as it gives me a flavorful base for the game. I have added to it customized names based on the top 100 boys names, girls names and surnames in England right now.

My next plan for names is to bring in the rest of the world, weighted towards Great Britain overall, to give it a Harry Potter vibe. Basketball GM's default names have always seemed too modern and basketball for this purpose.


Quidditch GM: Changes from Baseline BBGM


Quidditch GM is still basketball GM, just with a few simple changes to the BBGM code base at this point. My goal is to make it more Quidditch, less Basketball, one change at a time.

According to Github, I am currently 20 commits ahead of the BBGM code. That means, I've made 20 changes from it, and Dumbmatter, the creator of BBGM has not posted any new changes to the master repository since I started working on this.

  1.  Added the harrypotter_teams.json file, which should be imported when creating a new league.
  2. Added a now way out of date planning document (quidditch plan.md). I will do my planning here instead, so that's going away.
  3. Added logo files for the team logos used in harrypotter_teams.json. These were on imgur before when I was running the json through the main BBGM website instead of locally on my pc. Now they are in the repository.
  4. Nav Bar says Quidditch GM.
  5. GameSim.js: This is the meat of the real changes that make the game more Quidditch-like:
    1. Fatigue per possession reduced by 10. Previously fatigue was getting ridiculous, to the point where no one made any shots and a single game went on forever.
    2. Instead of ending regulation if the 4th quarter is over, end if the 21st quarter is over. This is a copout to prevent endless games where a snitch is never caught.
    3. After a possession, end the game immediately if either team has made a 3 pointer (conceptually: 3s are now Catching the Snitch).
    4. Eliminate free throws from 3 pointer attempts (catching the snitch doesn't let you score a quaffle). Allow only 1 free throw if fouled in a 2 pointer attempt.
    5. Reduce chance to make 3 pointer by a factor of 10. Catching the snitch is harder than making a 3.
    6. Reduce chance of making 2 pointer by half. Scoring a goal with the quaffle should be harder than a basketball 2 pointer. And scores were getting ridiculous.
    7. Reduce the benefit of assists to made shot % by half (to scale with the rest of the odds).
    8. 2 pointers are now considered scoring a goal with the quaffle. 10 points as in Quidditch.
    9. 3 pointers are now considered catching the snitch. 150 points as in Quidditch.
    10. Free Throws are still in the game, but worth 5 points (half a goal) now (shoot once if fouled). I want to remove FTs completely soon, but not yet.
    11. Free Throw make chance cut in half, like 2 Pointer make chance.
    12. Quarter length set to 48 (from 12), because games were running to that last 21st quarter too often. Works in conjunction with the fatigue reduction to make box scores more legitimate.
As a result of these changes, the game feels a bit Quidditchy, but the BBGM engine is now stretched and stressed in weird places.

Here are some box scores from a season I just simulated as the Ravenclaw Eagles:

Example Game 1

Lost 15 to 180 against the Wimbourne Wasps. My team made 1 goal and 1 free throw. Wasps made 2 goals (20 points), 2 free throws (10 points), and caught the snitch (150 points) to end the game in the 1st quarter. 


Example Game 2

Lost 1040 to 1550. The game ended on time with no snitches caught after the end of the 16th overtime period. One of my players went 0 for 142, trying to catch the snitch.


So it's completely ridiculous when interacting with a Fatigue Model from Basketball GM, that expects games to last 4 quarters, maybe even 7 quarters with Triple OT, but never 16 OTs, and never ending quick games in 1 quarter.

But it definitely has a Quidditch feel. If the snitch can't be caught, the game keeps on going. If someone catches the Snitch quick, you lose badly.


PER Ratings / Player Valuation / Free Agency


However, the main reason I wanted to post, is that these Quidditch changes completely break the Player Efficiency Rating (PER) advanced statistic, which is not only for display in the UI, but also used for player value calculations.

According to Basketball-Reference.com, for the 2017-2018 NBA season, these are the top PER players (https://www.basketball-reference.com/leagues/NBA_2018_leaders.html):

Crit
RkPlayerSeasonAgeTmPER
1James Harden2017-1828HOU30.5
2Giannis Antetokounmpo2017-1823MIL28.8
3Anthony Davis2017-1824NOP28.2
4LeBron James2017-1833CLE27.7
5Stephen Curry2017-1829GSW27.4
According to the same site, the lowest PER ratings for players with 30 games played minimum (to exclude oddball cases): 

CritCrit
RkPlayerSeasonAgeTmGPER
1Marcus Georges-Hunt2017-1823MIN344.2
2Semi Ojeleye2017-1823BOS514.3
3Dwayne Bacon2017-1822CHO354.5
4Arron Afflalo2017-1832ORL434.7
5Josh Huestis2017-1826OKC535.1

PER is calculated so that the average is 15. Usually the best are around 30, the worst at near 0.

Now let's look at Quidditch GM's PER tables for my simulated 2017-2018 season, after a full regular season:

Player Efficiency RatingPER
1. Joshua Johnston13BPsCHU151.2
2. Jack Howell3BPsSAL100.8
3. Adnan Rodgers3BPsBUL100.7
4. Jayden Taylor3BDpPsBAL100.0
5. George English10BPsBEA94.5
6. Patrycja Price53BPsMAG83.1
7. Aiden Paul2PsWIZ76.7
8. Safiyyah MoseleyBAPP76.6
9. Reece BairdAPP76.2
10. Julia Ashton3ABDpPsKOL72.5

I couldn't find a way to pull up a list of worst PER examples, but here are a few I just found on 1 team's bench:

Maya Poole: -35.2 PER
Philippa Gibbons: -46 PER

And I think the issue is showed most starkly between a Point Guard and a Power Forward, both with the same overall player rating in the game: 38 (awful, worst player in the league level).

James Knight - PF - 6.8 points per game: +/- of +25.9, but his PER is -31.0

Mikolaj Roberts - PG - 1.4 points per game: +/- of 23.6, but his PER is 41.1

Two players, both should be awful, one of them has better than James Harden PER, one has worse than Josh Huestis PER.

So, in summary, the changed length of games, and chance of making shots has busting the traditional PER statistic beyond repair.


Quidditch PER


How should a Quidditch PER work?

Let me go back to the basketball PER, and find out what it is doing. According to a Basketball Reference blog post, called Calculating PER, PER "is a per-minute rating developed by ESPN.com columnist John Hollinger. In John's words, 'The PER sums up all a player's positive accomplishments, subtracts the negative accomplishments, and returns a per-minute rating of a player's performance.'"

So PER is a per-minute rating of accomplishments in Basketball.

Let's work out Mikolaj Robert's ridiculous 41.1 PER in my QGM simulated season.

Roberts has a stat line of:


In Excel, I started working on the formula in Calculating PER, using Mikolaj's stats, team stats where the formula requires it. I noted almost immediately that Mikolaj takes only 0.5 3s a game, and makes none of them.

My league intermediate values for the calculation were:

Factor  VOP   DRB%
0.665605  1.469407 0.750613

Unadjusted PER is basically adding up 12 terms, some which are good things, some bad things, and then dividing by minutes played.

Mikolaj's values don't look impressive so far with the 12 sub sums.

#1 #2 #3
0.000 0.333 0.157
#4 #5 #6
0.000 -0.735 -2.757
#7 #8 #9
-0.167 0.073 0.000
#10 #11 #12
0.588 0.000 -0.067
These total up to -2.57488

We divide this by his minutes per game, which is 0.09901

So Mikolaj's Unadjusted PER is -26

How does he get to 41.1?


The next step is to adjust for pace:


pace adjustment = lg_Pace / team_Pace

According to the glossary referenced in the article, pace is:

Pace Factor (available since the 1973-74 season in the NBA); the formula is 48 * ((Tm Poss + Opp Poss) / (2 * (Tm MP / 5))). Pace factor is an estimate of the number of possessions per 48 minutes by a team. (Note: 40 minutes is used in the calculation for the WNBA.)

I don't have Time of Possesion or Opponent Time of Possesion. I tried to get pace, but for now I skipped it, because I have no idea how to do it. And the final PER calculation is more important

After taking my pace adjustment, then I calculate PER
PER = aPER * (15 / lg_aPER)

If League average PER is negative, and every Player's pace adjusted PER is negative, than PER will work in reverse. The more negative your performance, the larger positive your PER will be when you divide by average per.

Quidditch PER Answers


Even within this lightly modified basketball GM Quidditch, the PER formula is already way off. First of all, 3s are now worth 15 times more than a 2 point fg, rather than 1.5 times, even if you don't consider the Game Ending aspect of it. 

PER considers 3 Pointers made as one of it's factors.

FGs made are scaled by (2 - factor * team_ast / team_fg) * FG

For Slytherin, Mikolaj's team, that multiplier is (2 - 0.665 * 0.65) = 1.56

Since FG = 2P + 3P
These two summands can be rewritten as:

3.56 3P + 2.56 2P

If we rescale PER calculations so that 5 old points = 1 new point, then, instead of adding 1 more point to represent 3 pts vs 2 pts, we need to add 28 points to represent 150 points (30 * 5) vs. 10 points (2 * 5).

So the term 3P would be changed to 28 * 3P.

This is the easiest, smallest change we can make to PER. Let's try it out and see how it affects things. PER may still end up League negative in the average, because both 2 and 3 pointers have their chances reduced.

I replaced players[i].stats.tp in the code with 28 * players[i].stats.tp. Rebuilt the Node setup and launched a season, running it through the regular season.

Player Efficiency RatingPER
1. Joseph TaylorBPsBAL87.9
2. Noah BartlettBAL84.6
3. Frankie CookPUD76.2
4. Sophie BaileyPsBEA75.0
5. Lily Parry3BPsSAL74.7
6. Spencer Williams3PUD74.0
7. Theo AliILV73.9
8. Jessica Robins3BPsBAL73.5
9. Edward Cox3GOB72.2
10. Mariam Collins5WIZ72.1

There's a few 3 point shooters here, but mostly random guards again.

If I go into the Debug Console, maybe I can find the Average aPER in the league? Not really.

Seth Welsh: amazing player:

Seth Welsh3ABDiDpGF2417881$30.00M thru 20188074.365.426.81.439.4

Only 39.4 PER.

Let's look at the PER leader with 87.9

Overall rating 57.
Horrible player.

Redoing Advanced Stats for QGM v. 0.0.6, Completely


I need to put together a statistical model for QGM, that will assign reasonable PER values based on actual contribution to winning games.

I think it would be easier to target EWA and then back-correct that to PER, the opposite of how BBGM calculates PER and then translates to an EWA value.